
L3 Estimator
Delivering the most accurate financial predictions for DC fast-charging projects.
We combine multiple real-time data sources, a proprietary siting and performance algorithm, and HUMAN REVIEW to ensure every report is precise, reliable, and ready for decision-making.
At a glance, you’ll see if your site is
“GO” or “NO-GO”
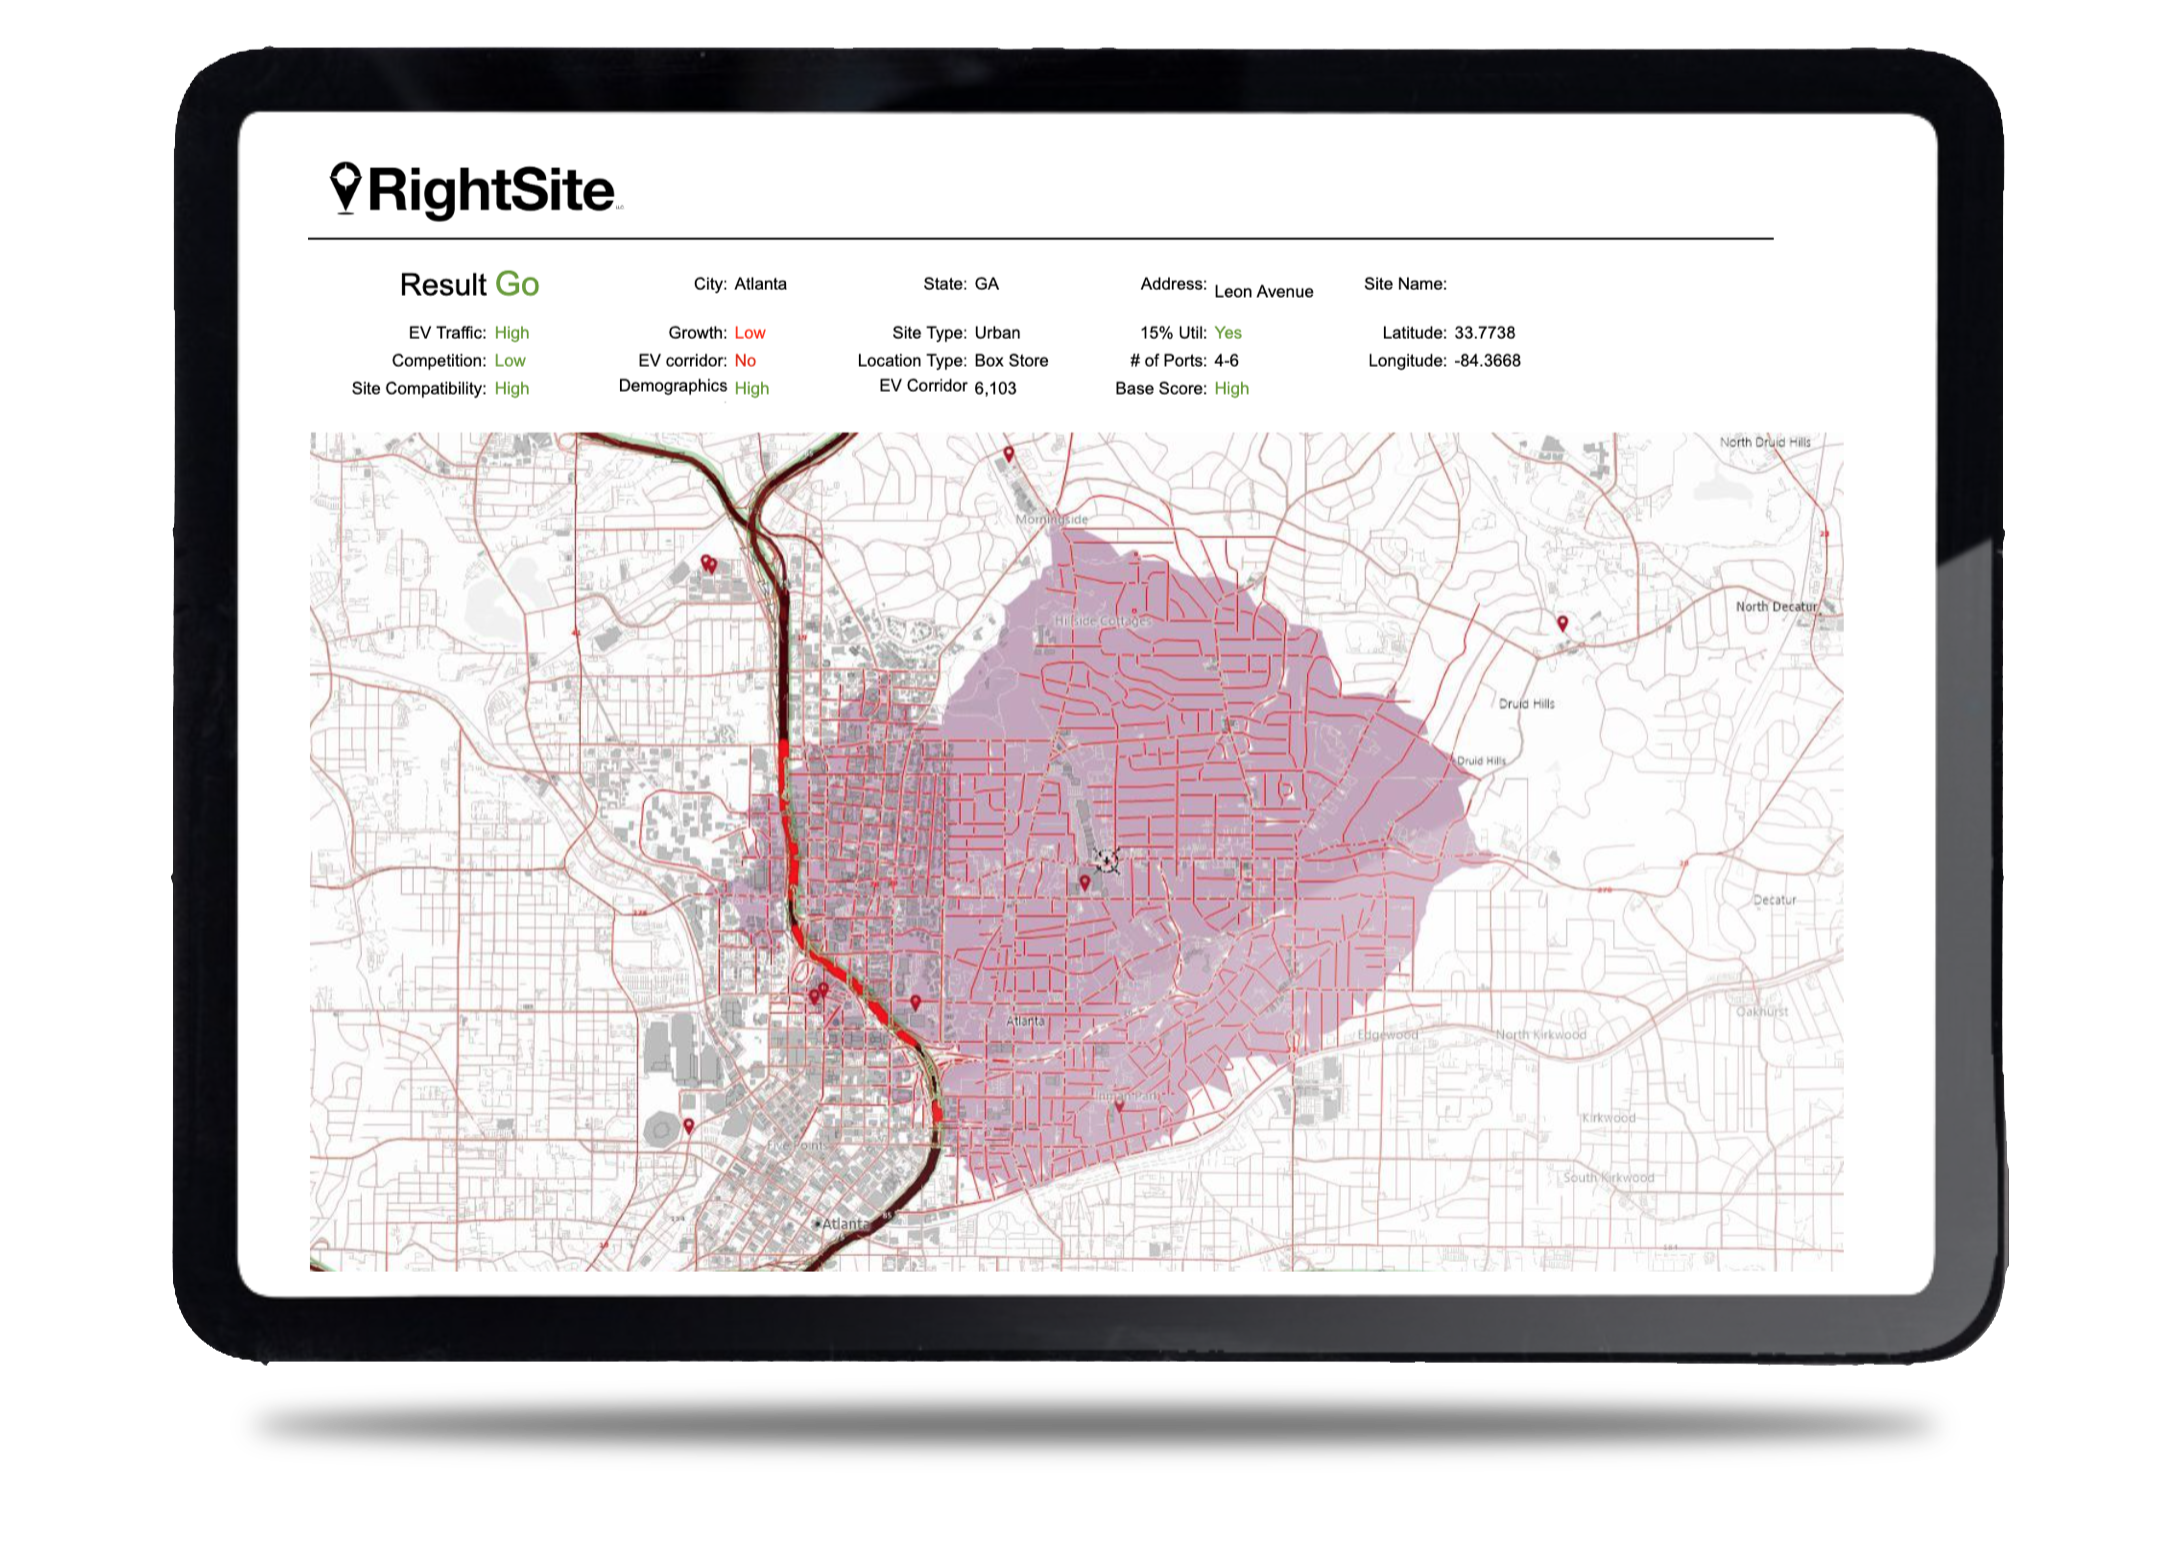
If your site is a “GO”, dive deeper for details.
Revenue Estimator
The Revenue Estimator tool provides predictions for revenue generation that includes default values and gives you the ability to enter custom data.

Energy Estimator
The Energy Estimator runs every possible utility plan for the site using the predictive utilization data to find the plan with the best value for your site.

Utilization Estimator
The Utilization Projection tool gives valuable insights where to place charging stations to meet the growing demand for electric vehicles.

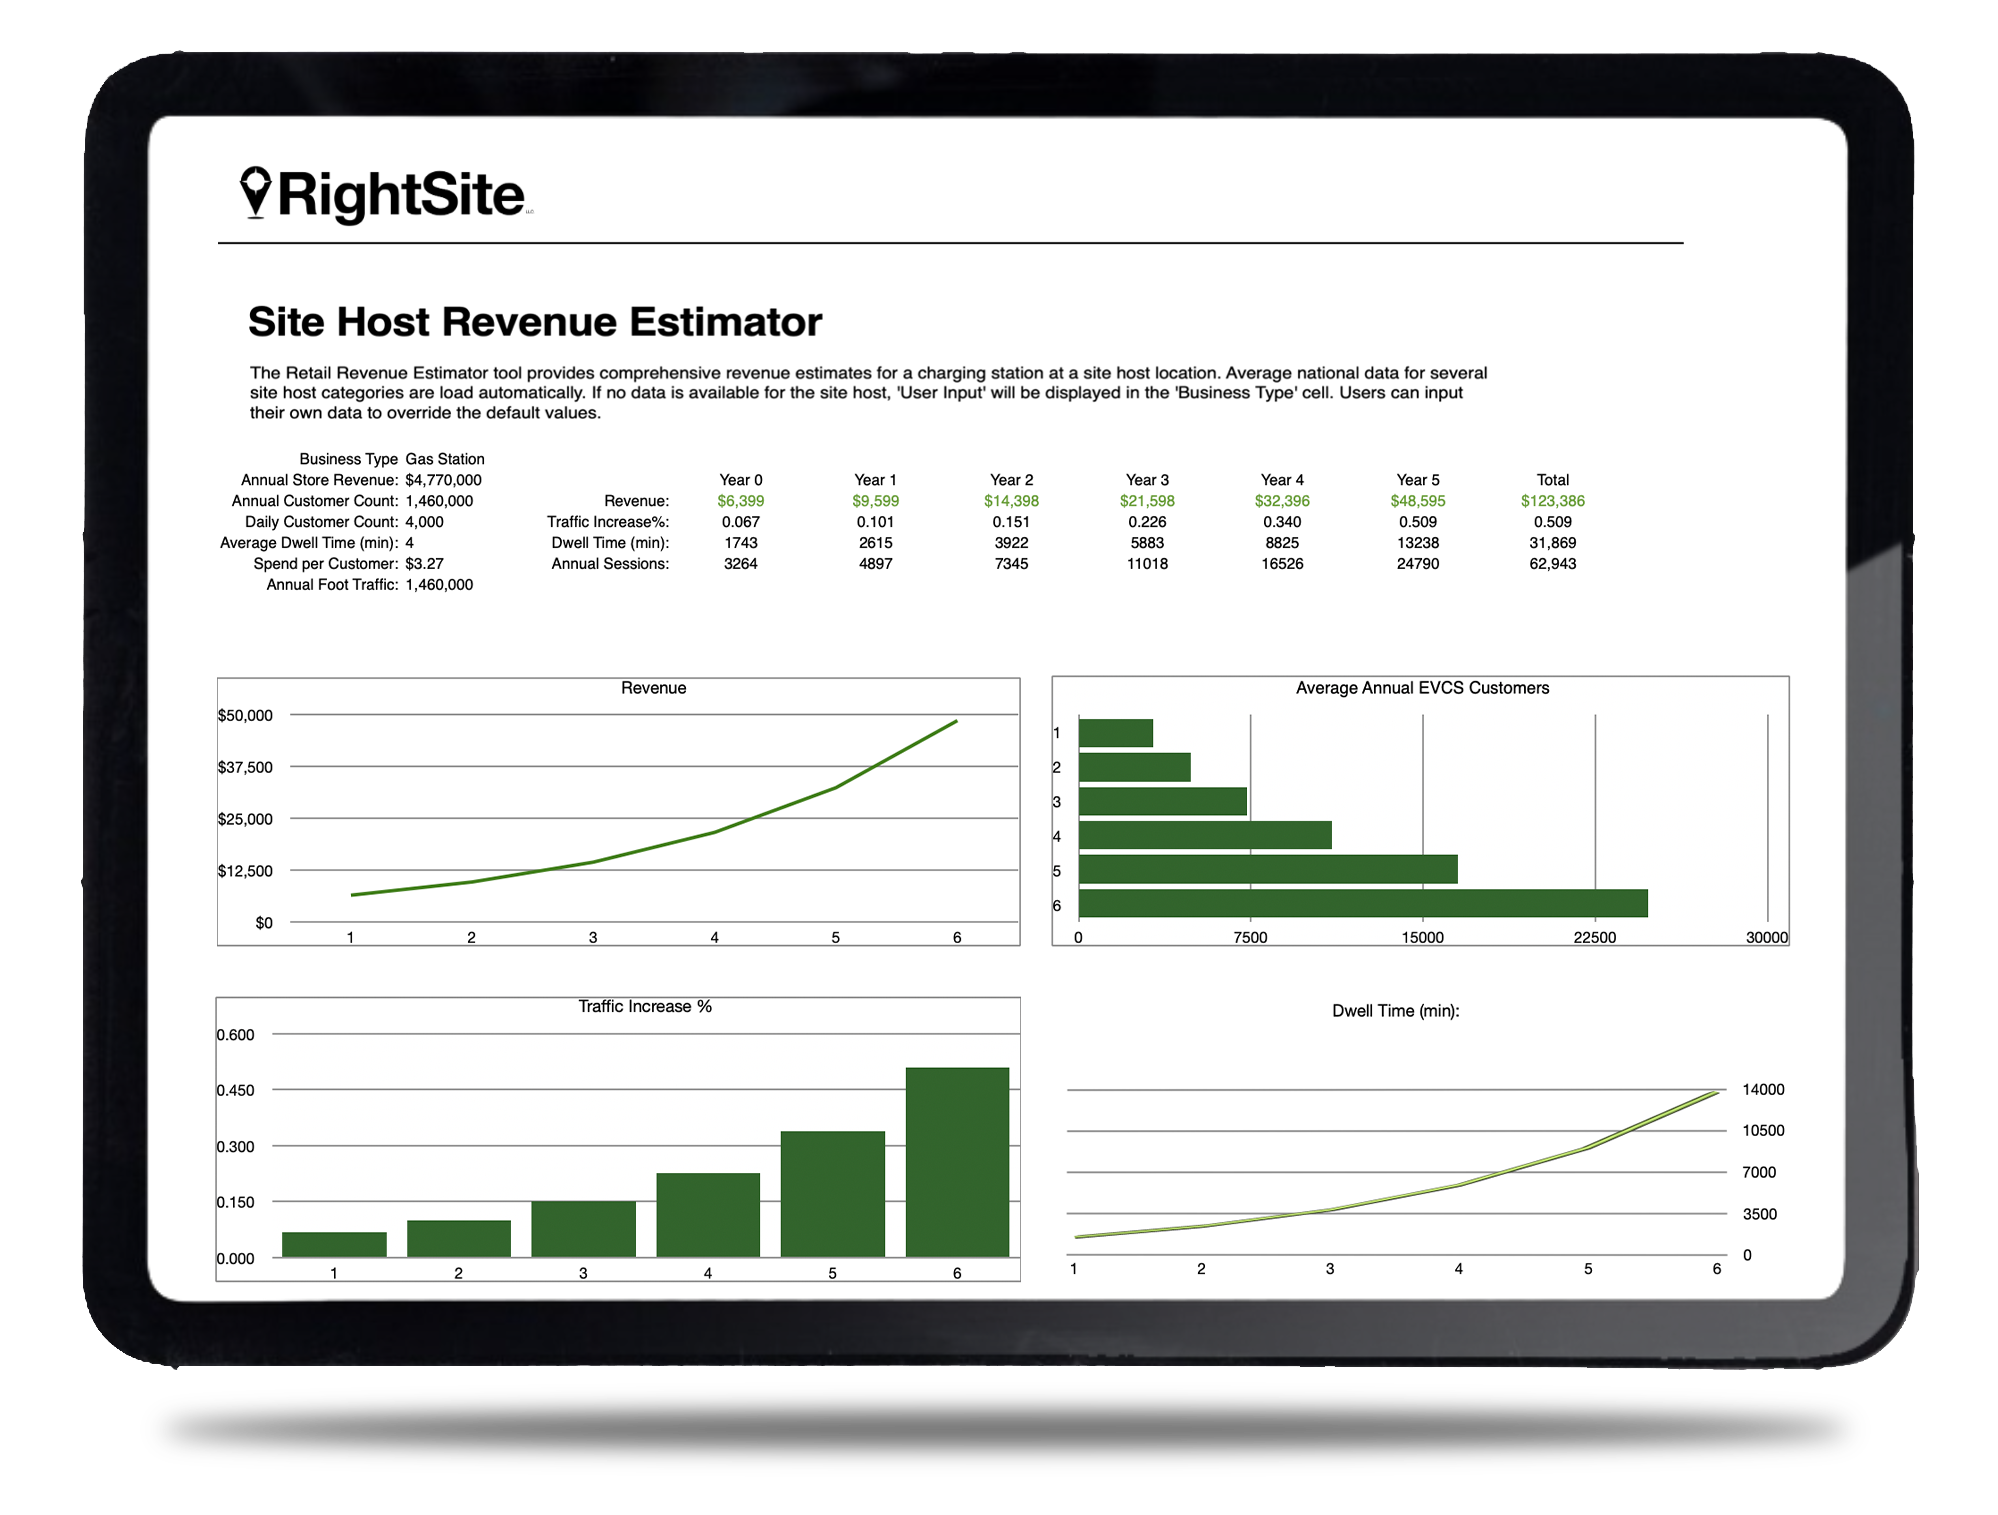
Site Host Estimator
The Site Host Revenue Estimator shows how adding EV chargers will increase customer traffic, extend dwell time, and projected revenue over five years.
Use Cases & Who It’s For
Ideal for:
Developers and site owners evaluating potential DCFC sites (corridors, retail, hospitality, mixed uses)
Charging network operators planning new stations or expanding footprints
Utilities studying load impact, grid interconnection feasibility, or planning upgrades
Investors and lenders assessing revenue, payback, and long-term returns before funding installation
Municipalities or commercial landlords vetting site viability before committing space or capital
What Makes This Report Different
Data-backed & conservative-by-default: Assumptions reflect current grid tariffs, demand-charge regimes, and realistic EV usage — not idealistic optimism.
Flexible scenario modeling: Run best-case, worst-case, and baseline scenarios to test robustness and risk.
Full lifecycle view: From day-one capital cost to 5- or 10-year cash flow and NPV — not just first-year revenue.
Adaptable: Supports varied station sizes, power levels, and market conditions.